By Laurie Henry
Satellites are incredible tools for observing the Earth and especially the ocean which covers more than 70% of our planet. From their orbits, they provide us with much more information than would be possible to obtain from the surface alone. In December 2022, the most powerful satellite dedicated to land and sea topographic observation SWOT (Surface Water and Ocean Topography) was successfully launched thanks to the collaboration between the American NASA and the French Center National d’Etudes Spatiales (CNES) . SWOT has thus joined a space arsenal allowing the modeling of ocean currents, a key tool for understanding the oceans and their interactions with the atmosphere, the biosphere or the continents.
The oceans are a major reservoir of heat, fresh water, salt, nutrients and carbon in the Earth system. Ocean circulation plays a crucial role in regulating climate by transporting heat from low to high latitudes in surface waters (such as the Gulf Stream from the Gulf of Mexico to Europe), while cooled currents at high latitudes flow in deeper water towards the equator.
Nevertheless, knowledge of the role played by the oceans in the Earth system is currently insufficient to be able to make accurate predictions of their state. This is why researchers use satellites. The information collected can tell them about ocean bathymetry, sea surface temperature, ocean production (nutrients, oxygen, etc.), coral reefs, sea ice, etc.
A recent paper published by Morrow et al., 2023 explains how our global multi-satellite and in-situ observation networks are combined and assimilated to characterize the ocean circulation in 4D, essential for climate and weather predictions.
Surface data and deep modeling
To collect oceanographic data, remote sensing satellites equipped with altimeters send a signal, an electromagnetic wave like a radar, at a given speed towards the surface. The time it takes for the wave to return makes it possible to deduce its distance from the surface.
All of these satellite observations “only” measure the topography (or height) of the sea surface. gravity and ocean circulation, but also by temperature.
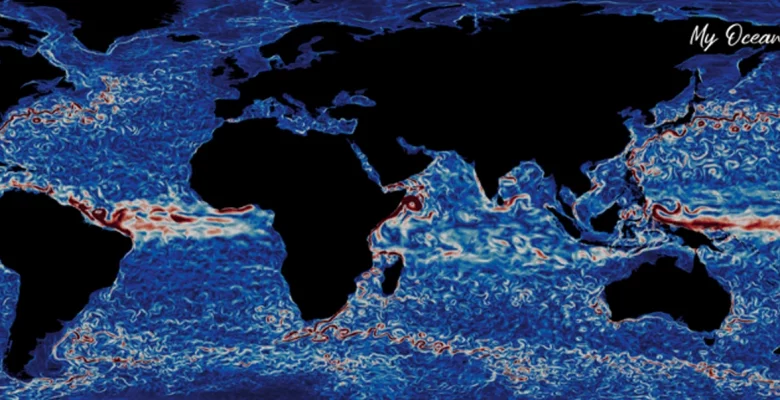
Indeed, hot water has the particularity of expanding, while cold water contracts, which changes the height of the water surface. Scientists can deduce patterns of ocean circulation such as upwelling locations (or rising cold waters) or warm water currents, such as the Gulf Stream.
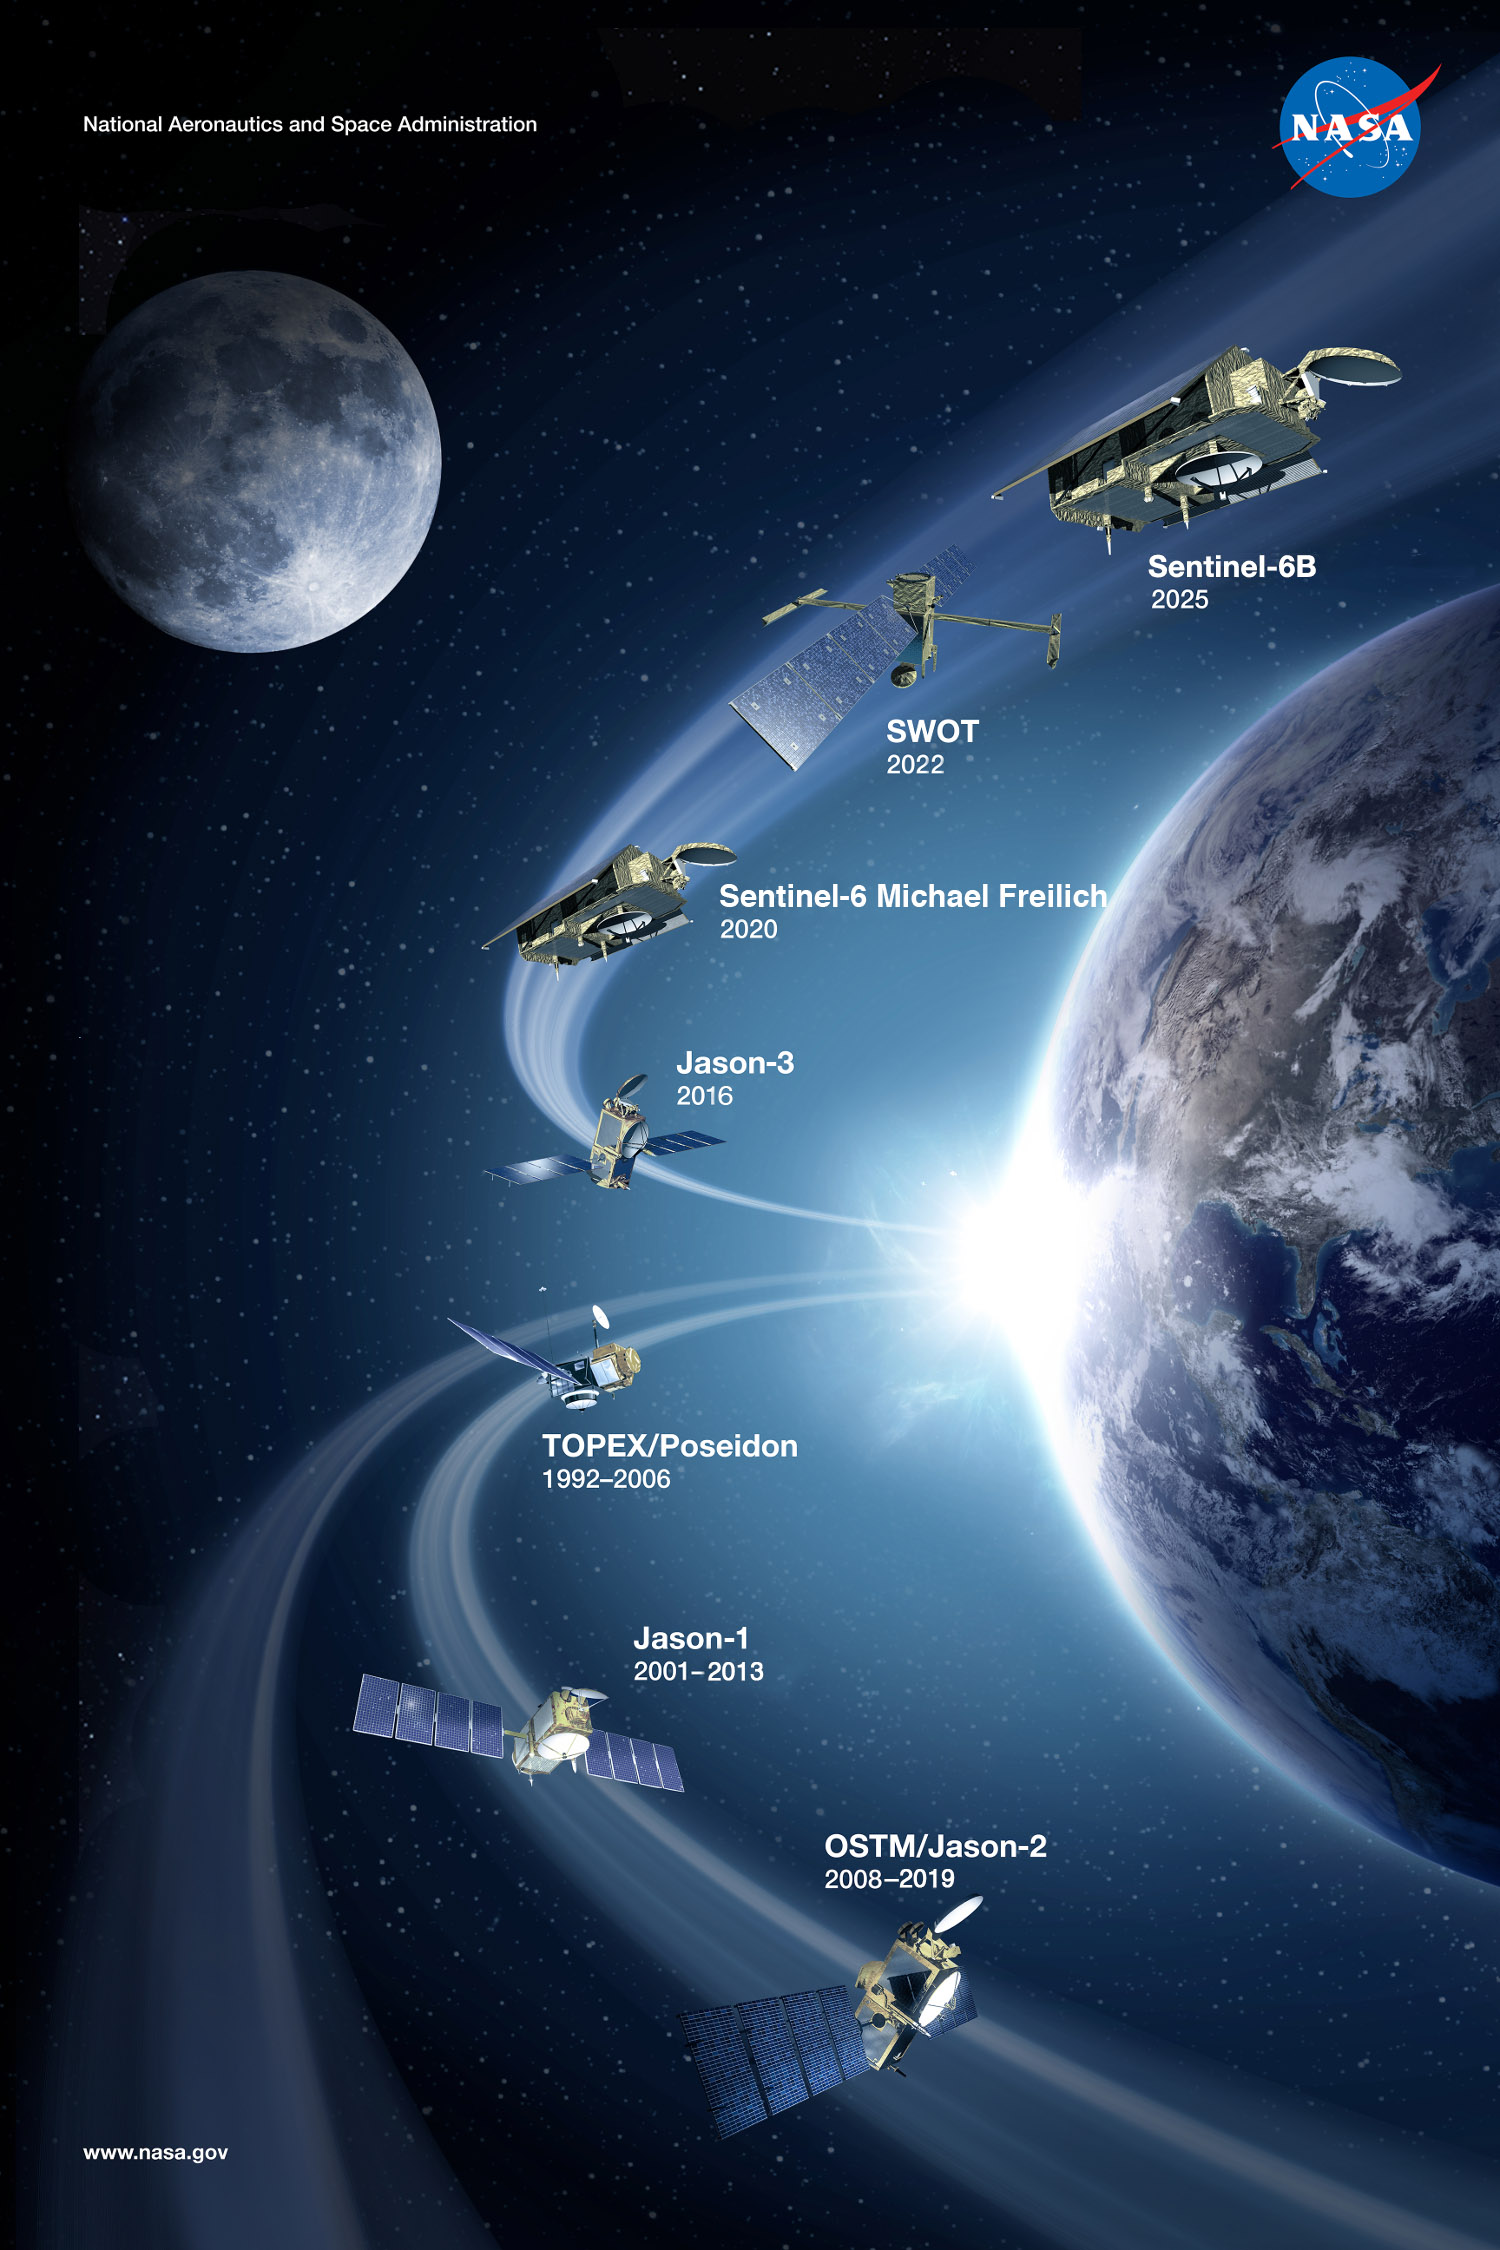
Arsenal of satellites for the study of the oceans. ©NASA
Complementarity of in situ and satellite data
The Morrow et al. (2023) emphasizes the great complementarity of satellite data and in situ data, particularly since the development of the international Argo program.
Indeed, since the early 2000s, Argo has enabled the deployment of more than 4,000 floats on all the world’s oceans. Each float samples the temperature and salinity of the ocean in the first two kilometers of the water column. This global in-situ measurement is complementary to observations collected on board ships, mooring data or observations collected from surface dinghies.
Satellite information is then cross-checked with this in-situ data, and projected onto maps by geographic information system (GIS) software to allow 4D visualization of ocean currents. This visualization of the different masses of water with different physical characteristics and their circulation in relation to each other helps to better understand in order to better predict the effects of the evolution of the oceans on the climate machine. Extreme and recurrent climatic events such as El Niño or La Niña have for example already been observed thanks to these maps in the Pacific in 1997 or 2015.
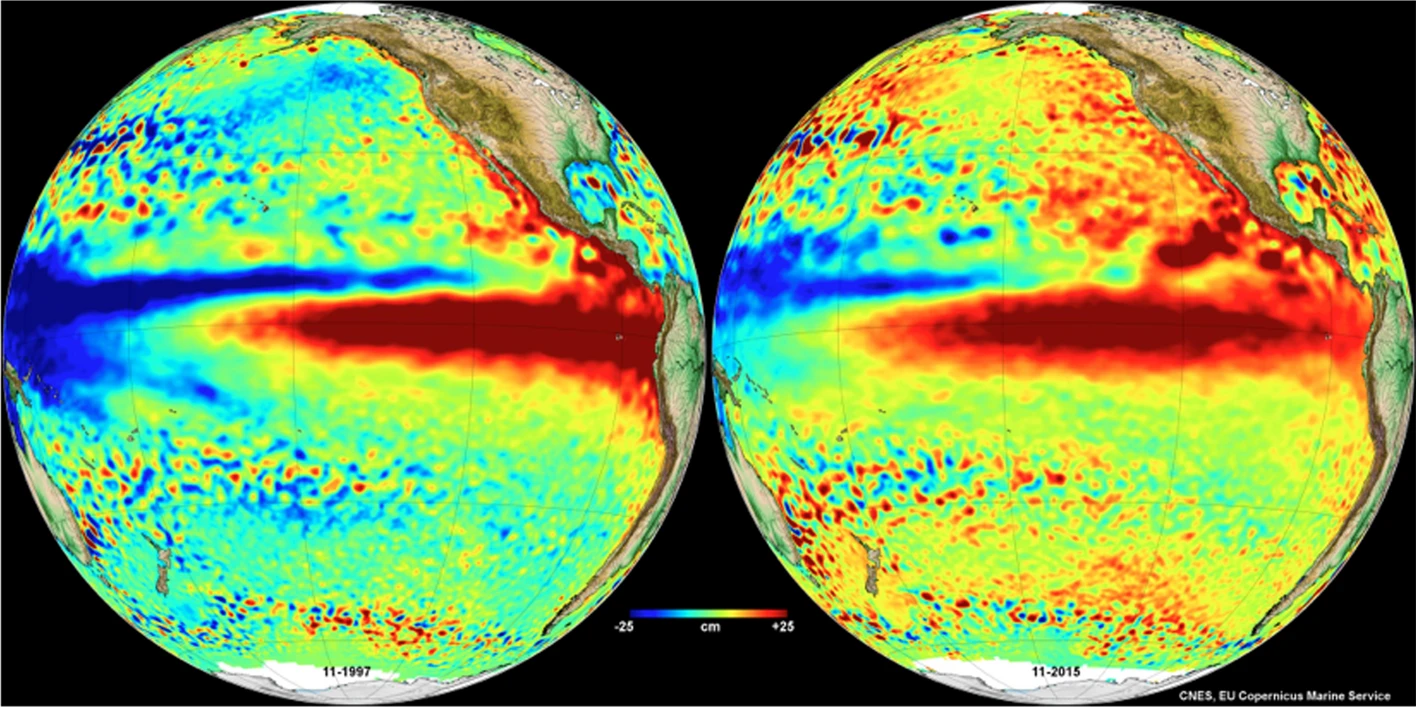
Sea level elevation anomalies during the 1997 (left) and 2015 (right) El Nino events in the eastern Pacific. © CNES / EU Copernicus Marine Service
Technological evolution, SWOT and the future
Remote sensing has seen its performance increase with the use of wide-swath Synthetic Aperture Radar (SAR) interferometry modes. Behind this name hides a tool that, in a simple way, works like the echolocation of certain marine mammals to navigate. Except that instead of electromagnetic waves, the satellite sends out microwave pulses allowing it to “see” through darkness, clouds and rain. We also speak of a wide swath because the SAR can study an area of 50km, compared to 5 to 10km for traditional models. The pulse returns to the satellite and the sensor creates an image from the returned echoes.
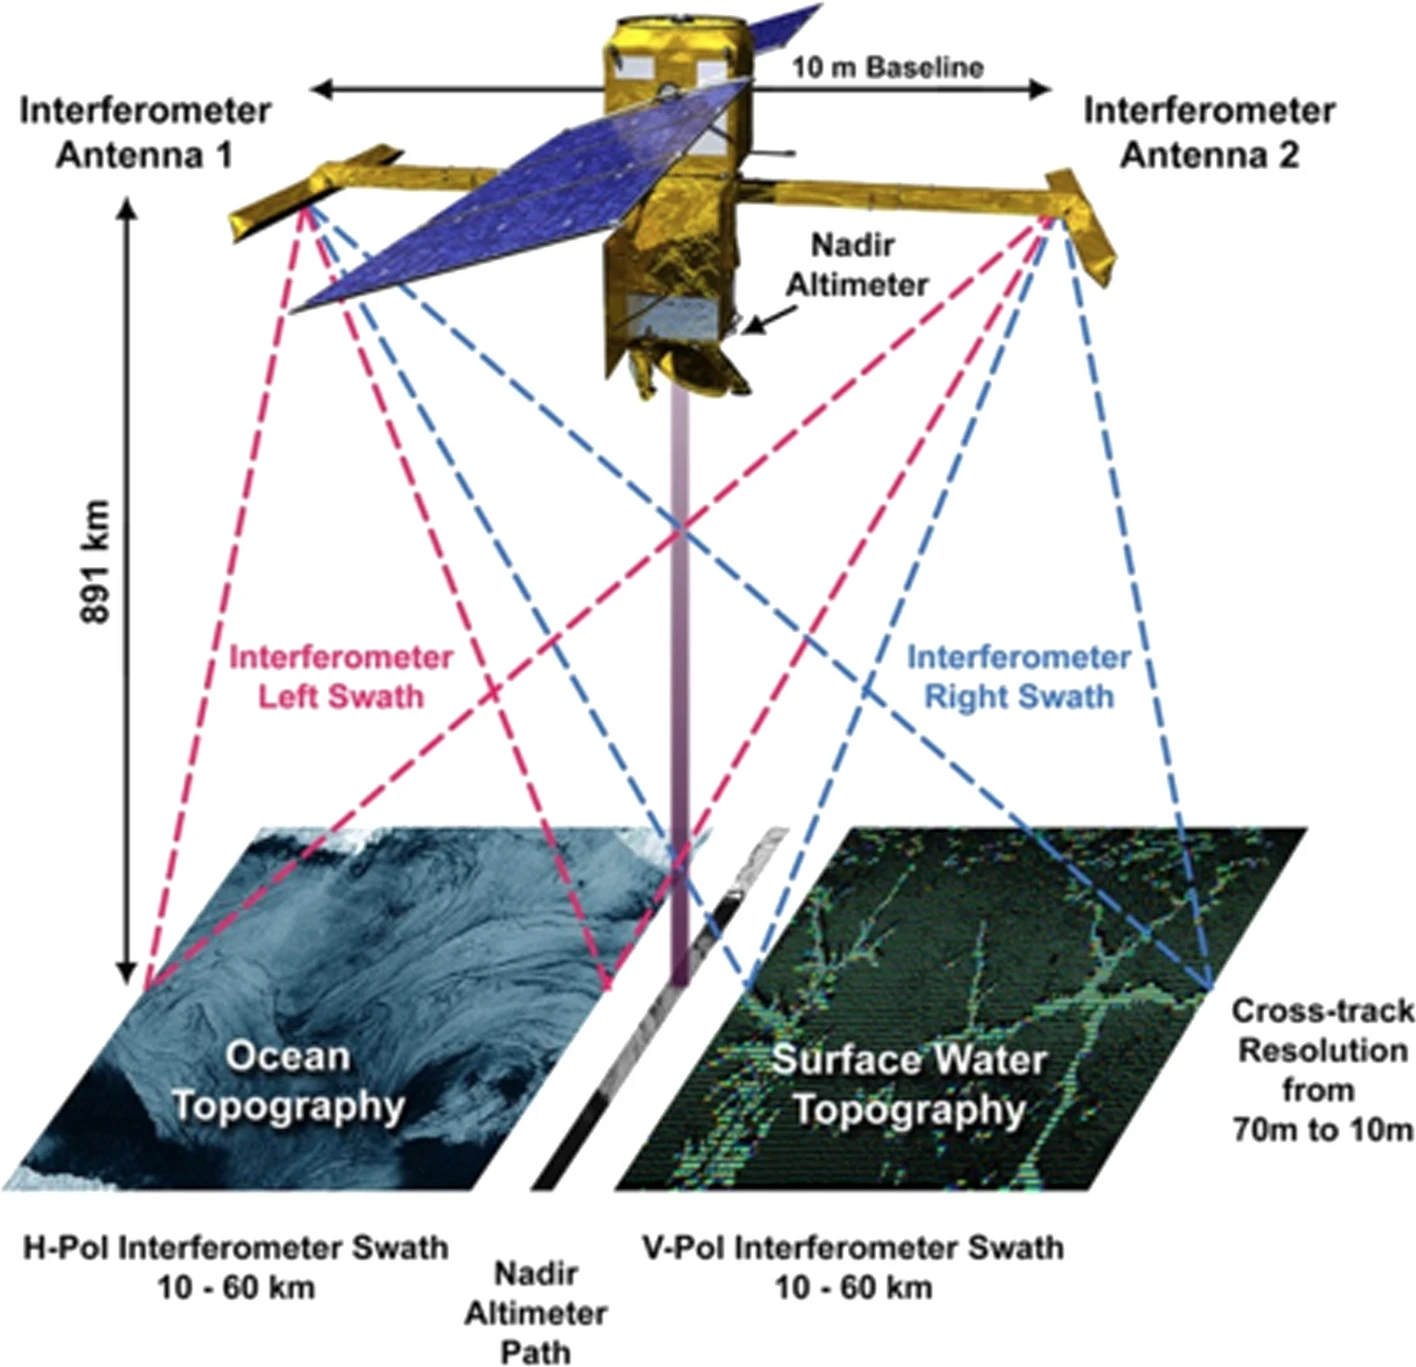
Configuration of SWOT and cross remote sensing. © K. Wiedman / NASA-JPL
It is this tool, in addition to a conventional altimeter, that the SWOT satellite embarked in December 2022 in duplicate, each at the end of an antenna on either side of the satellite. This configuration makes it possible to obtain more robust cross-data. The spatial resolution of SWOT ocean measurements is ultimately 10 times higher than the composite of sea surface height data collected over the same area by seven other satellites: Sentinel-6 Michael Freilich, Jason-3, Sentinel-3A and 3B , Cryosat-2, Altika, and Hai Yang 2B.
In January, the first images from SWOT show ocean currents like the Gulf Stream in unprecedented detail. But there are still many challenges to be met, mainly the synchronization of all this space arsenal available but also the ability to observe ocean circulation at higher latitudes such as in the polar areas where the presence of sea ice still prevents the observation of the surface of the ocean.