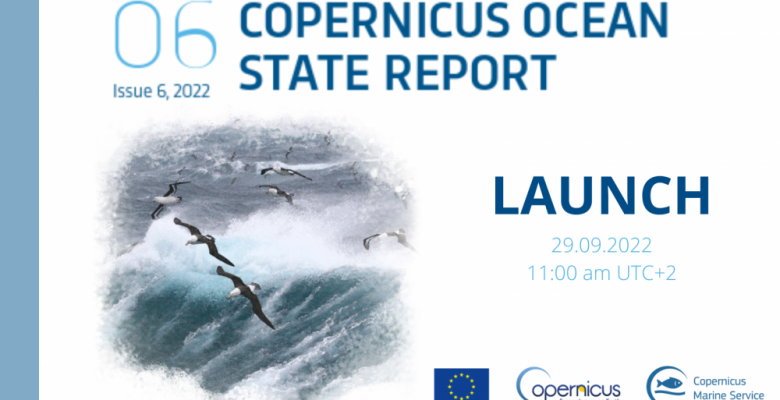
By Laurie Henry – Source: Copernicus
The Copernicus Marine Environment Monitoring Service (CMEMS) publishes for the European Union, its 6th report on the state of the ocean. Based on a synthesis of data collected on a global scale and on the European regional seas, it draws up an inventory of the health of the oceans of our planet, by scanning three main axes: the physical state of the oceans, its biological state (fauna and flora) and the state of the ice.
A benchmark report based on robust data
After six years of operation, the Copernicus Marine Service is internationally recognized as one of the most advanced service capabilities in ocean monitoring and forecasting. It is now used by approximately forty thousand expert services and users worldwide.
The Copernicus Marine Service Ocean State Report (COSR) provides an annual reference report for the European Union. Written for political decision-makers, environmental agencies, Peripheral Maritime Regions of the EU and international organizations (such as the IPCC or the OECD for example), it aims to increase public awareness of the state and changes in the marine environment and to highlight the importance of ocean data to better understand and adapt to changes.
Thus, based on expert analysis, each report provides regular and systematic information on the physical and biogeochemical state of the global ocean, as well as on its variability, its dynamics and the health of its ecosystems. In this 6th COSR report, a new 4D view of the ocean is obtained for the period 1993-2020 by reanalysis systems (ie the examination of old data through current numerical models and algorithms) as well as by the combination data obtained from the surface of the oceans (by remote sensing) to the greatest depths (by in situ measurements, CTDs in particular).
In this new report, special attention is paid to the year 2020, which has been closely observed for two particularities:
- It is one of the years recorded with the smallest extent of sea ice in the Arctic and along the Siberian shelf since the beginning of the records made possible by satellite measurements since the end of the 1970s,
- In May 2020, the Mediterranean Sea experienced a marine heat wave of remarkable intensity, reaching conditions qualified as extreme in almost the entire eastern basin, exceeding the usual state by 6°C in the middle of the month.
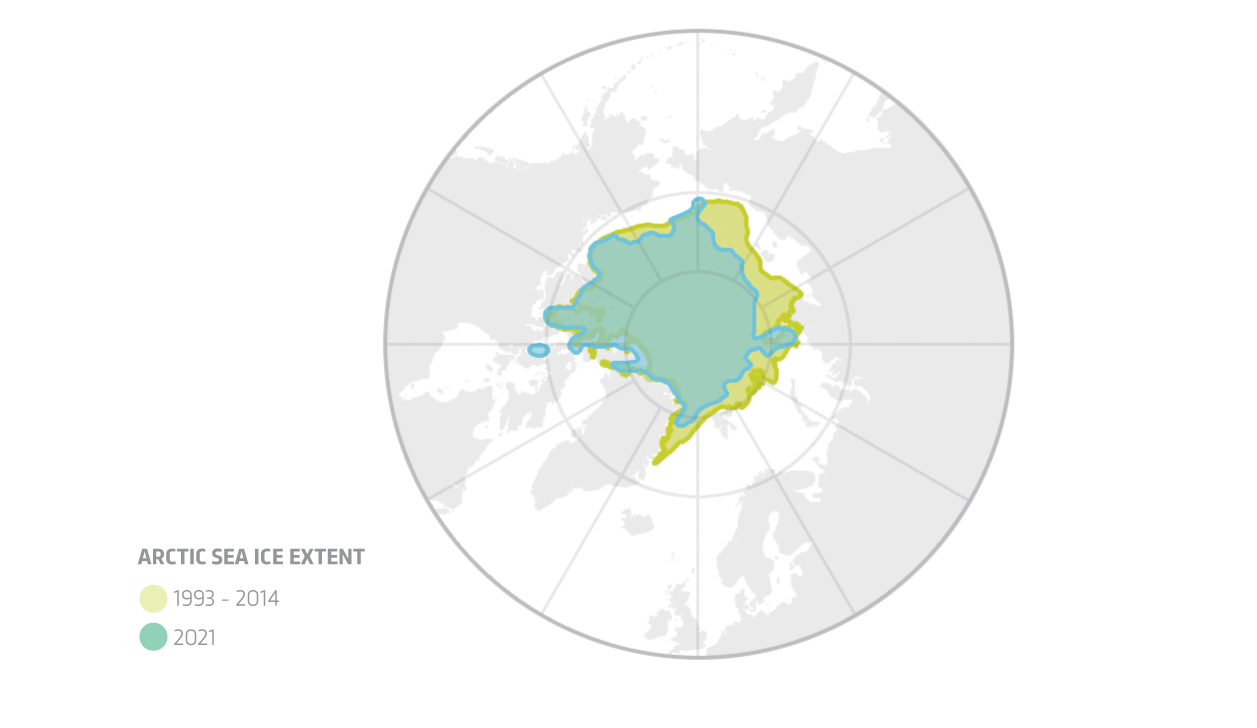
Arctic ice extent 2021 (green) compared to the 1993-2014 average (yellow) © Copernicus
Three main categories
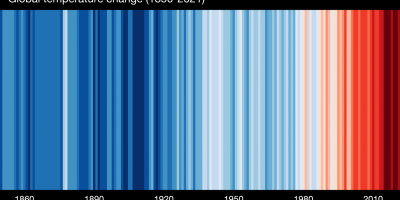
This 6th report is structured around three themes, examining the evolution of the ocean according to climate change:
- The “Blue Ocean“, which focuses on the physical state of the ocean such as surface temperature, sea level, ocean currents, waves, sea winds, water temperature, salinity and density.
- The “Green Ocean” which focuses on the biological and biogeochemical state including the rate of chlorophyll (index for phytoplankton and algae), the rate of nutrients, the acidification and deoxygenation of the oceans
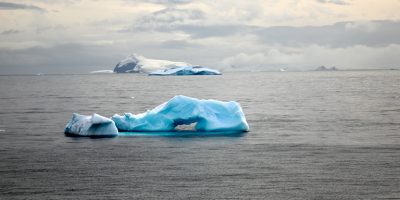
- The “White Ocean“, which works to account for the life cycle of the mass of floating ice in the polar regions, with indicators including the extent, volume, thickness of sea ice Baltic, Arctic and Antarctic Ocean.
Why collect ocean data? What benefit to society?
The attention of the public and of political decision-makers has been focused on these data for ten years, as a result of the violent storms that European coasts have experienced and which have caused numerous damages and human losses. Reliable and comprehensive information tools must make it possible to predict these risks in order to minimize their consequences, but also to assess and understand the changes taking place in the ocean over the long term.
These data, summarized in the 6th report, thus form the basis of sustainable ocean management, ie the way in which we manage, use and conserve ocean resources. Concretely, the data provided and synthesized in this report show us where and how changes are happening.
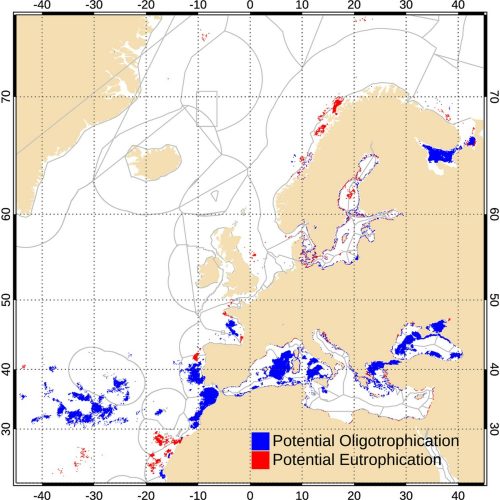
Map showing sites sensitive to eutrophication in Europe © Copernicus
A new eutrophication indicator for European waters is, for example, presented in this 6th report, based on satellite observations. The interest is to identify potential causes and sensitive areas, in order to establish plans to limit human-induced pollution and protect marine ecosystems. Indeed, the impact of eutrophication on aquatic ecosystems is well known: water containing many nutrients (often of human origin, via wastewater) stimulates the growth of plants degrading the quality of the water and oxygen availability, which in turn can lead to the death of aquatic organisms.
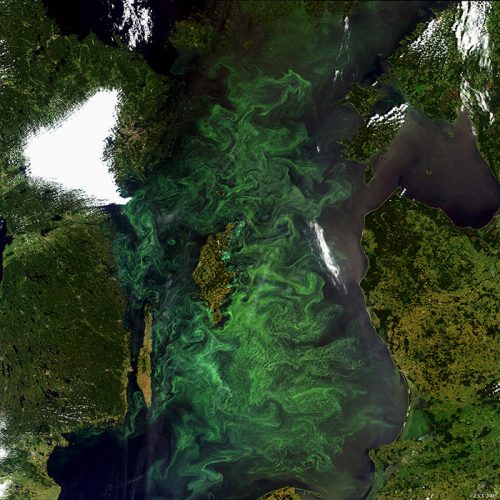
Microalgae growth peak in the Baltic Sea, illustration of eutrophication © Alix Levain et al., 2022/ Special Edition VertigO n°33
Copernicus Marine Service data collection and reporting activities are essential to our understanding and ability to predict changes in the ocean. It is a necessity to guide government actions and policies aimed at preserving biodiversity, sustainably managing marine resources, reducing pollution and mitigating climate change. Sustainable ocean management must be based on sound scientific understanding and on ocean monitoring and forecasting capabilities.