By Laurie Henry
Phytoplankton biomass exhibits substantial year-to-year changes, and understanding these changes is particularly crucial for fisheries management and future climate projection. First explained by the climate machine, these annual variations could also be due to the turbulence of the oceans.
In recent decades, several studies have shown that the quantity of phytoplankton (biomass) tends to decrease in response to climate change. But researchers have difficulty quantifying these changes, as the natural variations are so important.
Upwellings and natural variability
Phytoplankton is made up of small microscopic algae that are almost always less than a millimeter in size. A size inversely proportional to its importance, since phytoplankton constitutes the basis of the entire marine food chain: no phytoplankton, no zooplankton, and therefore no marine animals!
To grow, these microscopic algae need nutrients, located in the deep, cold layers of the ocean, such as nitrogen and phosphorus (which come from decaying organisms at the bottom of the oceans). These nutrients go up largely thanks to the mixing, in winter, of surface waters with those deeper and richer. They can also rise to the surface thanks to the upwelling phenomenon.
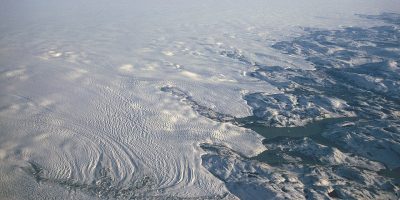
Upwelling is a physical phenomenon that originates in coastal areas. Under the effect of constant winds along the coast, surface waters are displaced from the coast towards the open sea, thus causing an upwelling of deep cold waters near the coasts. These cold waters, laden with nutrients, then cool the surface layer, which itself becomes denser and is then naturally drawn to the bottom. This new dive again causes a new rise of deep waters rich in nutrient salts towards the surface. And so on…
There is also an upwelling phenomenon due to climatic conditions. For example, to cite just one case, during El Niño events, the temperatures of part of the waters of the Pacific Ocean are abnormally warm and the depth at which nutrients are found changes. Problem, as underlined by Marina Levy, oceanographer CNRS research director and deputy director of the “Ocean, Climate and Resources” department of the Research Institute for Development (IRD), in a press release: “If these phenomena explain the major part of the variability of phytoplankton in some regions (tropical Pacific and Indian oceans), this is not the case everywhere”.
In a new study (M. G. Keerthi et al., 2022) published recently in the journal Nature Geoscience, Marina Levy and her colleagues analyzed radiometric satellite measurements made between 1999 and 2018 over oceans around the world. They associated them with phenomena occurring on small spatial and temporal scales, eddies and turbulence at oceanic fronts.
How to observe variations at small scales?
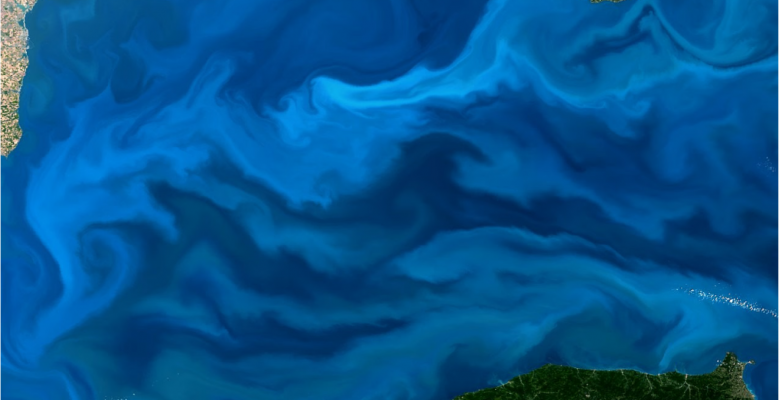
To estimate phytoplankton biomass and its variations, researchers rely on daily estimates of chlorophyll-a. It is a pigment present in all plants, which allows them to capture the light necessary for photosynthesis. The phytoplankton biomass is then deduced from the color of the water, captured by the satellites, because this pigment preferentially absorbs blue light. Depending on the color, it is estimated whether the biomass is significant (strong green color) or not (lighter color).
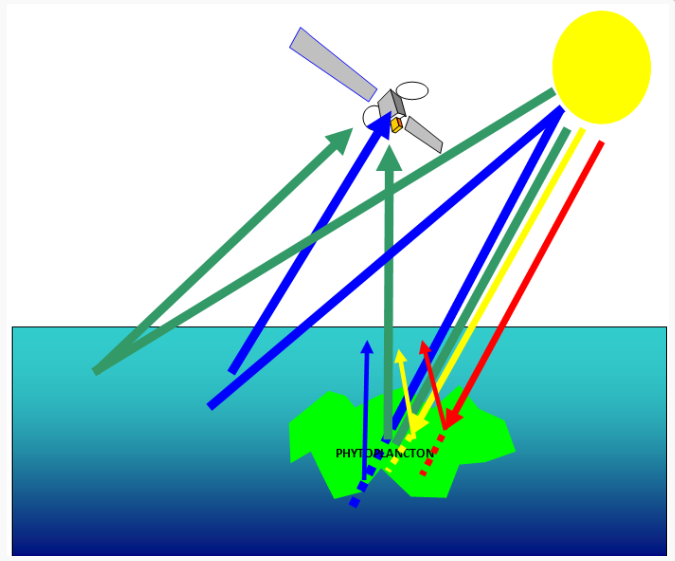
Due to its preferential absorption in blue, the concentration of chlorophyll-a is inversely proportional to this color. Phytoplankton-rich waters appear green because blue and red radiation is absorbed and only partially emerges from the water. © Phenomer/Ifremer
The seasonality of phytoplankton biomass is controlled by seasonal variations in the amount of solar energy received, winds and surface stratification (difference in density between the warm surface layer and the deeper cold layer, which is denser). These factors modulate nutrient availability, light exposure and dilution rates.
The authors of the study M. G. Keerthi et al., 2022 analyzed the natural variations of chlorophyll, taking into account fine temporal scales rather than spatial ones. The goal was to establish the main driver of the decline of phytoplankton established for several years.
Phytoplankton feed on the natural turbulence of the oceans
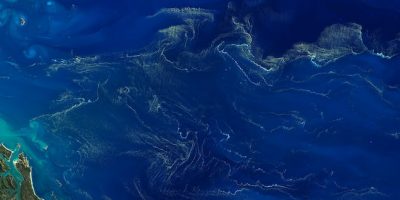
The authors were particularly interested in the natural changes in chlorophyll associated with eddies and turbulence, arising at the boundary of two water masses of different temperatures.
The researchers found that in some regions, such as the Arabian Sea, these phenomena can contribute more than 50% of the average variation in phytoplankton occurring from year to year.
Specifically, they noticed that the greatest variation (30%) occurred on time scales less than 3 months and corresponding spatial scales less than 100 km. This percentage is relatively high given the fact that the dominant natural variations are seasonal.
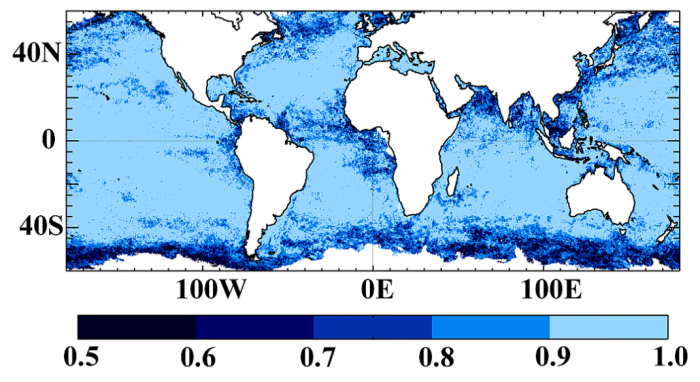
The index, from 0 to 1, shows the regions of the ocean where small-scale turbulence contributes the most to changes in the amount of phytoplankton from year to year (regions in dark blue). © M.G. Keerthi et al., 2022
In a press release related to the study, Marina Lévy explains:
“We also showed that small-scale variations can accumulate over the year and lead to variations in phytoplankton quantities from one year to the next. Much of what we know about decadal and longer-term trends in primary productivity is based on biogeochemical models. Based on our results, there is an urgent need to assess the capabilities of the latest models to simulate turbulent motions at the ocean surface.”
Because if these models are biased, it will be difficult to estimate and predict the impact of climate change on the production of phytoplankton, and by repercussion on all marine ecosystems.
Source : Keerthi, M.G., Prend, C.J., Aumont, O. et al. Annual variations in phytoplankton biomass driven by small-scale physical processes. Nat. Geosci. (2022). https://doi.org/10.1038/s41561-022-01057-3