
Ocean acidification is an alarming phenomenon that is accelerating rapidly, affecting marine life and ocean ecosystems. In this context, it is vital to understand the extent of these changes. This is why researchers have developed an innovative visualisation tool, Ocean Acidification Stripes, to highlight the evolution of this phenomenon over the last four decades and raise public awareness of the environmental implications of ocean acidification.
By Laurie Henry
OCEAN ACIDIFICATION, A MYSTERY TO THE GENERAL PUBLIC
The common perception of climate change is often reduced to the idea of simple atmospheric warming, mainly impacting land areas. This largely anthropocentric understanding is unfortunately incomplete and superficial. Indeed, this approach tends to obscure the significant impact of climate change on the oceans. They absorb almost a third of the carbon dioxide (CO2) emitted by human activities.
While this has protected humanity and terrestrial ecosystems to some extent, the effects on the oceans are alarming: warming, unprecedented deoxygenation and a host of related changes that further compromise the stability of our climate. One consequence that is often overlooked by the public is the progressive acidification of marine environments.
Let’s look briefly at what this involves. When CO2 comes into contact with seawater, it reacts with the water to form carbonic acid, a substance that then dissociates into bicarbonate ions and hydrogen ions, making the seawater more acidic. This increase in the acidity of seawater, or decrease in oceanic pH, upsets the marine chemical balance. It affects the ability of many marine organisms to form calcareous shells and skeletons, thus impacting marine biodiversity and ocean ecosystems.
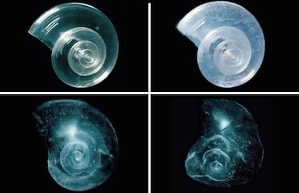
A shell placed in seawater with increased acidity dissolves slowly over 45 days © National Oceanic and Atmospheric Administration, Pacific Marine Environmental Laboratory
Nicolas Gruber, professor of environmental physics at ETH Zurich and co-creator of the acidification ‘stripes’, explains in a press release: “Despite these changes, many people are unaware of what is happening to our oceans”. He adds: “As these organisms are often at the base of the food chain, they are essential to many marine ecosystems and are therefore also important to us humans”.
He underlines the prevailing ignorance about the profound transformations that our oceans are undergoing. He and his team hope to rectify this ignorance. The question is: how can such an abstract and complex phenomenon, occurring in such a vast and little-understood environment, be made tangible and intelligible to the general public?
CLEAR VISUALISATION FOR DIFFICULT SCIENTIFIC DATA
The “Ocean Acidification Stripes” tool was therefore designed to illustrate these changes in ocean acidity in a visual and intuitive way. The principle is simple but effective: it uses bands of various colours to symbolise fluctuations in ocean pH over time. Each coloured band represents a pH value, allowing us to visualise the variations and trends in ocean acidification over several decades.
Cooler colours such as blue represent higher pH levels (less acidic) and warmer colours such as red represent lower pH levels (more acidic). The transition from cooler to warmer colours indicates increasing acidification of the oceans over time.
The concept behind this tool was inspired by the “climate stripes” created by British climatologist Ed Hawkins. These also use coloured stripes to represent variations in global temperature, providing a striking visualisation of global warming.
FINALLY UNDERSTAND THE FACTORS BEHIND ACIDIFICATION
The tool developed by Nicolas Gruber and his colleagues is based on a robust and exhaustive data set, OceanSODA-ETHZ. It covers a significant period, from 1982 to 2021, and encompasses almost all ocean regions. This dataset was meticulously constructed by Gruber postdoctoral researcher Luke Gregor. To create OceanSODA-ETHZ, Gregor merged ship measurements and satellite data, using machine learning techniques to ensure the accuracy and reliability of the combined data.
This combination of data enabled an in-depth analysis of the trends and factors contributing to acidification. The researchers then highlighted a notable decrease in pH and aragonite saturation across the global ocean, key indicators of ocean acidification.
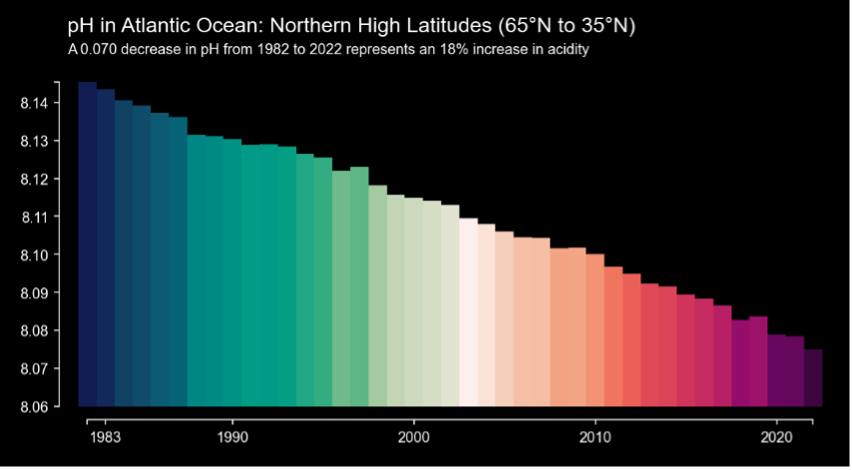
Visualisation of the decrease in pH for the Atlantic Ocean, in the Northern Hemisphere, at European latitudes © Nicolas Gruber & Luke Gregor / ETH Zurich
The main cause of these changes lies in the increase in dissolved inorganic carbon absorbed from the atmosphere. This finding unequivocally validates the hypothesis that anthropogenic CO2 emissions are the main culprit in the ongoing acidification of the oceans. There is therefore an urgent need to raise public awareness of ocean acidification and its devastating consequences.
Raising awareness and providing information have become the other challenges of climate change
As we have just seen, the approach adopted by ETH Zurich is based on simplification. By highlighting the evolution of ocean acidification in a visual and entertaining way, the initiative seeks to demystify a complex scientific concept and make it accessible to a diverse audience. The aim is to enable everyone, regardless of their level of scientific knowledge, to grasp the urgency and seriousness of the situation, and to understand the environmental issues involved.
Educators, for example, can use this tool to illustrate in concrete terms the impact of CO2 emissions on the oceans, and learners can explore different regions for themselves to see how acidification has evolved in different parts of the world.